|
Least-Squares Adjustment - Few Basic Concepts |
|
The Estimated Variance Factor One important adjustment result given by the report is the estimated variance factor ( Since the a priori variance factor is assumed to be known and equal to 1, the If the On the same principle, if the
The |
|
GNSS Network Adjustment Whether a large or a small GNSS campaign has been carried out, it is a common procedure to integrate each individual GNSS baseline into a network adjustment. The goal of the adjustment is to obtain a unique set of coordinates as well as valid representation of their accuracies.
The software’s network adjustment module takes as input vector’s solutions with their corresponding covariance’s matrix. This matrix is used to weight properly the vector’s solution in the adjustment. In accordance to this statement, very accurate observations should therefore have higher weights than less accurate observations.
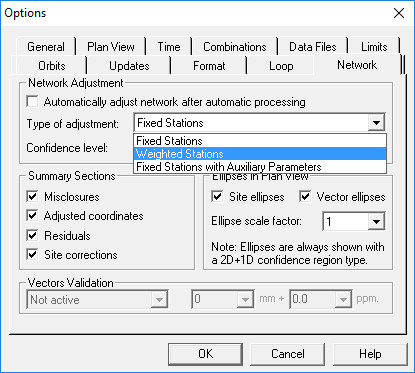
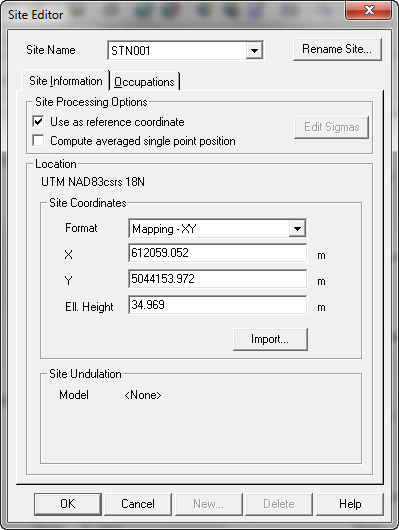
Also, a task that needs to be done before starting an adjustment is to select station(s) that will be held fixed during the process. The software will keep fixed all stations which have been selected as reference site (marked Use as reference coordinate in the Site Editor). If none of them are checked, the software will automatically select one to generate a minimally constrained solution. You can see in the network’s summary which station(s) were held fixed by looking at the Apriori Reference Stations Coordinates section. |
|
Chi Squared Test A common statistical test often used in network adjustment is performed by comparing the
■ Poor estimate of standard deviations and correlations of observations. The observation residuals are significantly larger or smaller than those implied by the input covariance’s matrices. They may be inappropriate and may require re-scaling. ■ Model or systematic error. Are enough parameters held fixed? ■ Significant gross errors in one or more of the observations, for example, blunders in the measurement of antenna height propagating into an incorrect baseline solution. ■ Poor quality (low precision) observations.
However, remember that it is still possible to make such errors and have a solution that still pass the chi squared test!
Standardized Residuals Another tool to analyse the adjustment results is by comparing all standardized residual (ratio of a residual over its sigma) against a statistical constant known as the residual critical value which is computed from the degrees of freedom and the Student’s distribution. Any standardized residual greater than the critical value is flagged in the report and may represent an observation outlier that needs to be rejected. |
|
Article: 000031 Related Products: EZSurv Last Update: 2017-03-30 20:05:44 |
|
Document information |
|
|